


Title
Description 
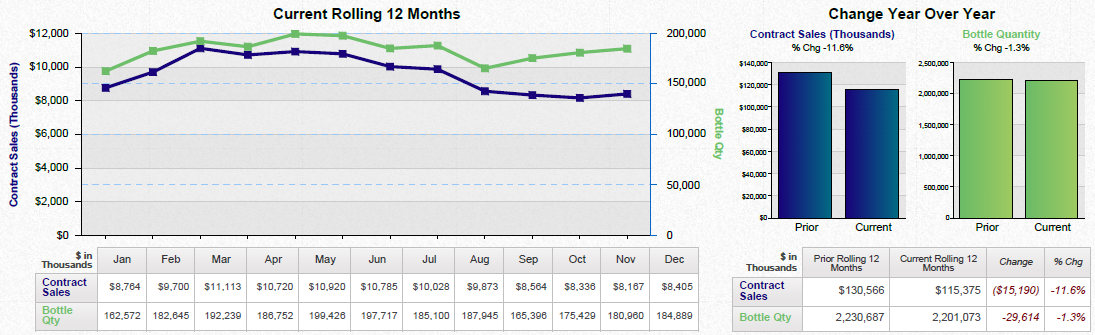
A group of data visualizations relating to Contract Sales and Bottle Quantity over the course of 12 months (between January and December of an unnamed year). It includes a run chart 2 bar graphs and 2 tables variously representing the Current Rolling 12 Months or the Change Year Over Year.
Type
Category
Source 1 of 3
-
Date
2013
Collection
-
Date
2013
Collection
-
Date
2013
Collection
We encourage you to view the image in the context of its source document(s) and cite the source(s) when using these images. However, to cite just this image alone, click the “Cite This Image” button and then paste the copied text.