Title
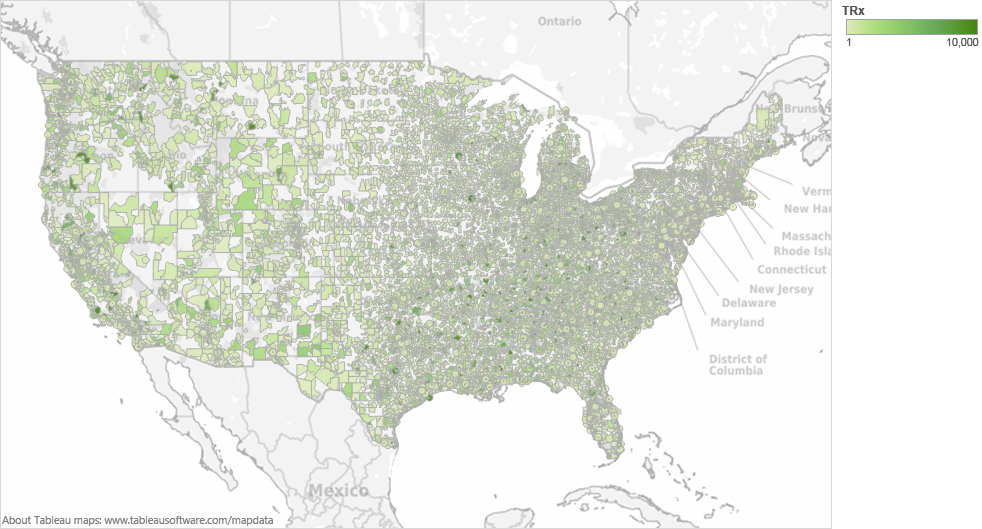
A map of the continental United States of America showing the number of TRx (Total Prescriptions) per 10000 people throughout the country. The map is color-coded with different shades of green - lighter shades representing fewer TRx and darker shades representing more TRx.
Category
Source 1 of 2
-
Date
2015
Collection
-
Date
2012
Collection
We encourage you to view the image in the context of its source document(s) and cite the source(s) when using these images. However, to cite just this image alone, click the “Cite This Image” button and then paste the copied text.


