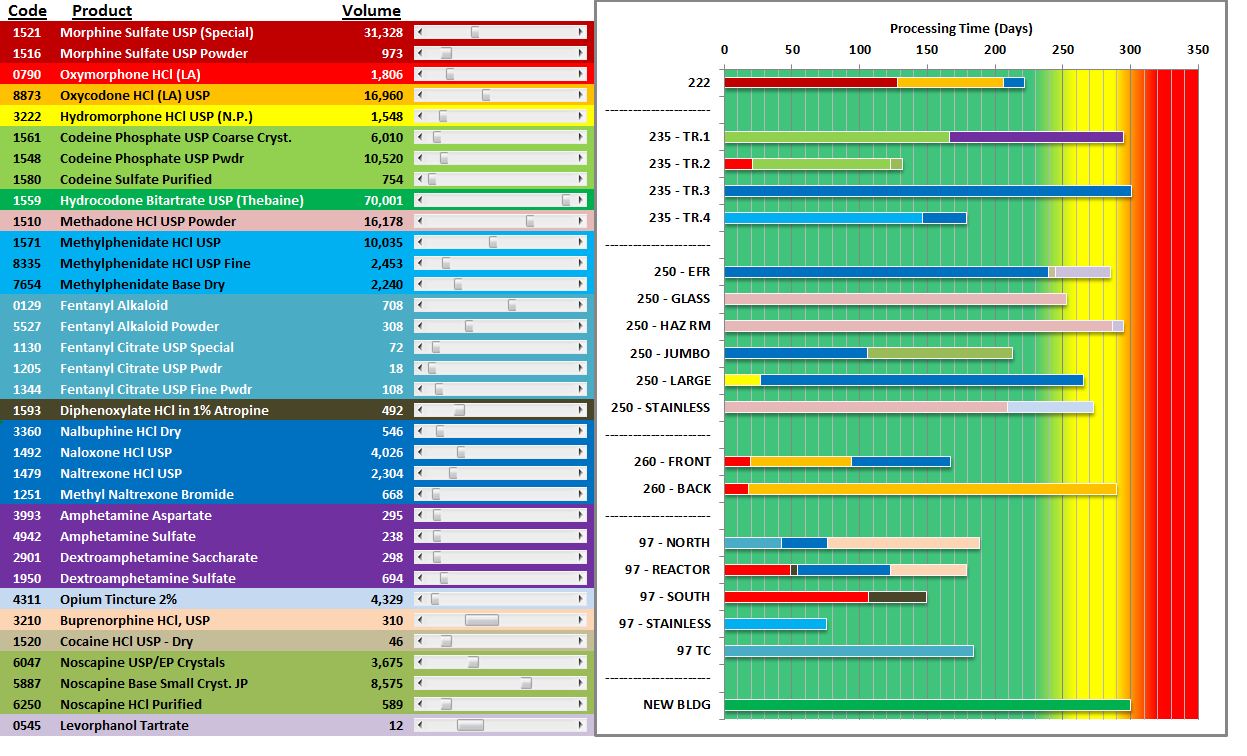
A screenshot of a spreadsheet. On the left hand side there is data reflecting the product codes names and volumes. Each row is color coded. On the right there is a bar graph that shows the processing time in days. The bars on the graph are color coded to match the products listed on the left side of the page.
Category
-
Date
2013
Collection
We encourage you to view the image in the context of its source document(s) and cite the source(s) when using these images. However, to cite just this image alone, click the “Cite This Image” button and then paste the copied text.

