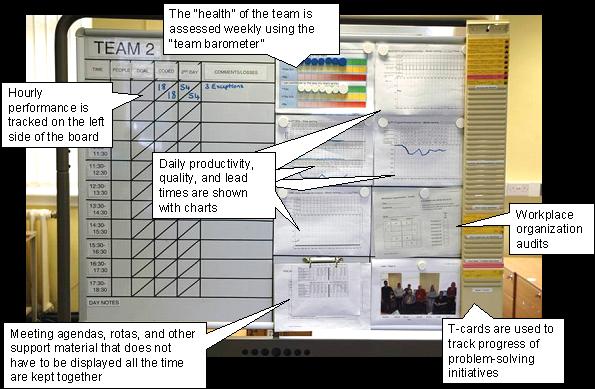
A whiteboard with a chart on it. The chart is titled "TEAM 2" and it shows the daily productivity quality and lead times that are shown with charts.
On the left side of the whiteboard there is a table that shows the hourly performance of the team. The table is divided into two columns one labeled "Hourly performance" and the other labeled "Daily productivity". The table shows that the team is assessed weekly using the team barometer.
In the center of the image there are several charts and graphs that provide detailed information about the team's performance. The charts are arranged in a grid-like pattern with each chart representing a different day of the week. The graphs are color-coded with different shades of blue green yellow and red representing different levels of performance. There are also several charts on the board including "Workplace organization audits" "T-cards are used to track progress of problem-solving initiatives" and "Meeting agendas rotas and other support materials that does not have to be displayed all the time are kept together."
The image appears to be a visual representation of a team's progress in a meeting or organization.
Type
-
Date
2005
Collection
We encourage you to view the image in the context of its source document(s) and cite the source(s) when using these images. However, to cite just this image alone, click the “Cite This Image” button and then paste the copied text.
![This is a diagram explaining how the Pathways of pain work. NMDA-mediated signaling (1) Disinhibition (2) and Microglia activation (3) are all discussed as well as how Touch and Pain are processed by the Brain. It was created by A. Bassbaum [et al.] in 2009 for Cell then used by Teva Pharmaceuticals at a later date.](https://oidaresourcesimages-cdn-endpoint-duhwc2gse6gdbng7.a01.azurefd.net/public/full/7b6ab15e-10b5-4f82-89d6-a999f519fc6e.png)
