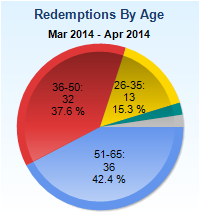
A pie chart with the title "Redemptions by Age : Mar 2014 - Apr 2014". It shows that older people were more likely to redeem escalating from 15.3% of people ages 25-35 to 37.6% of people ages 36-50 to 42.4% of people ages 51-65 (among the 81 people observed). The background is light blue with pie slices in blue red yellow green and gray with text in black.
Description
Category
Source 1 of 5
-
Date
None
Collection
-
Date
2004
Collection
-
Date
2014
Collection
-
Date
2014
Collection
-
Date
None
Collection
We encourage you to view the image in the context of its source document(s) and cite the source(s) when using these images. However, to cite just this image alone, click the “Cite This Image” button and then paste the copied text.

