Title
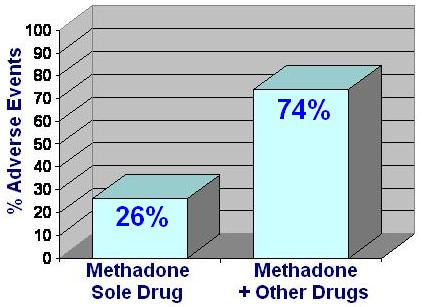
A bar graph that shows the percentage of adverse events in methadone and other drugs. The x-axis of the graph is labeled "Adverse Events" and the y-axis is labeled as "Methadone + Other Drugs".
There are two bars in the graph one in blue and one in gray. The blue bar represents 26% of the adverse events while the gray bar represents 74%. The bars are arranged in a horizontal axis with the blue bar representing 26% and the gray bars representing 74%.
Overall the graph shows that there are two adverse events for methadone one for sole drug and one for other drugs that are higher than the other.
Category
Drug
Methadone
Source 1 of 2
-
Date
2004
Collection
-
Date
2004
Collection
We encourage you to view the image in the context of its source document(s) and cite the source(s) when using these images. However, to cite just this image alone, click the “Cite This Image” button and then paste the copied text.


