OIDA Image Collection
Filters:
Reset 
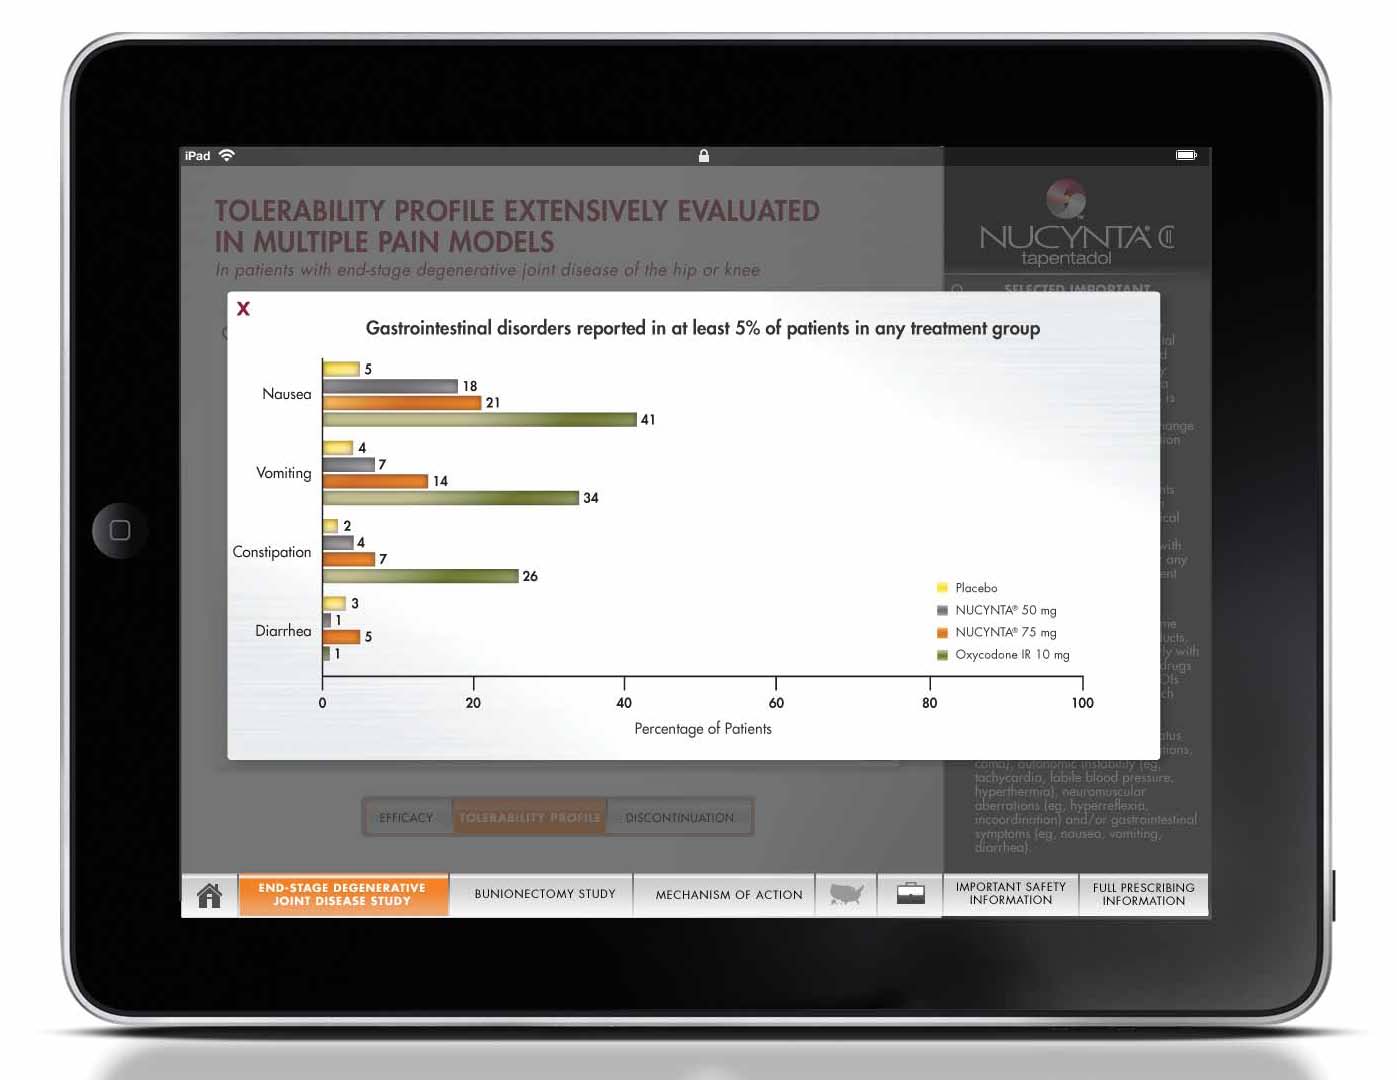
A screenshot of an iPad screen displaying a Tolerability Profile Extensively Evaluated in Multiple Pain Models. The screen is divided into three sections.<br /><br />The first section is titled "Gastrointestinal Disorders Reported at least 5% of patients in any treatment group" and has a bar graph that shows the percentage of patients who reported in multiple pain models. The graph shows that the majority of patients reported in the treatment group are Gastrointestinal disorders with the highest percentage being in the first group and the lowest being in a third group. The bars are color-coded with each bar representing a different type of treatment. The first bar shows the number of patients with gastrointestinal disorders reported while the second and third bars show the percentage that reported. The fourth and fifth bars show that the percentage reported is higher than the last group with a higher percentage than the previous group. <br /><br />At the top of the screen there is a title that reads "Tolerability profile extensively evaluated" and below the title there are several buttons and options for the user to navigate through the data. The iPad itself is black in color and appears to be a modern device with a sleek design.

Title

Nucynta ER : End-stage degenerative joint disease study section : Bar chart comparing the percentage of Gastrointestinal disorders reported in at least 5% of patients in any treatment group (for Placebo Nucynta 50 mg Nucynta 75 mg and Oxycodone IR 10 mg) (Nucynta web based content)

Description Generated using AI

A screenshot of an iPad screen displaying a Tolerability Profile Extensively Evaluated in Multiple Pain Models. The screen is divided into three sections.

The first section is titled "Gastrointestinal Disorders Reported at least 5% of patients in any treatment group" and has a bar graph that shows the percentage of patients who reported in multiple pain models. The graph shows that the majority of patients reported in the treatment group are Gastrointestinal disorders with the highest percentage being in the first group and the lowest being in a third group. The bars are color-coded with each bar representing a different type of treatment. The first bar shows the number of patients with gastrointestinal disorders reported while the second and third bars show the percentage that reported. The fourth and fifth bars show that the percentage reported is higher than the last group with a higher percentage than the previous group.

At the top of the screen there is a title that reads "Tolerability profile extensively evaluated" and below the title there are several buttons and options for the user to navigate through the data. The iPad itself is black in color and appears to be a modern device with a sleek design.

Drug

  • Nucynta

We encourage you to view the image in the context of its source document(s) and cite the source(s) when using these images. However, to cite just this image alone, click the “Cite This Image” button and then paste the copied text.

Information copied to your clipboard:

"Nucynta ER : End-stage degenerative joint disease study section : Bar chart comparing the percentage of Gastrointestinal disorders reported in at lea...