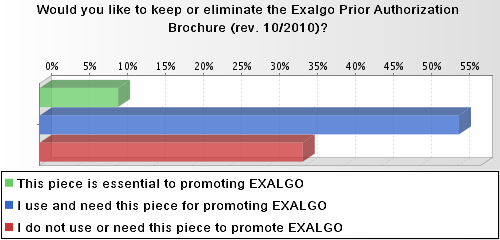
A bar graph titled "Would you like to keep or eliminate the Exalgo Prior Authorization Brochure (rev. 10/2010)?". The bar graph shows that approximately 10% of people chose "This piece is essential to promoting Exalgo". It shows that 55% of people chose "I use and need this piece for promoting Exalgo" and that between 30% and 35% chose "I do not use or need this piece to promote Exalgo".

Description
Category
Source 1 of 2
-
Date
2011
Collection
-
Date
2011
Collection
We encourage you to view the image in the context of its source document(s) and cite the source(s) when using these images. However, to cite just this image alone, click the “Cite This Image” button and then paste the copied text.


