Title
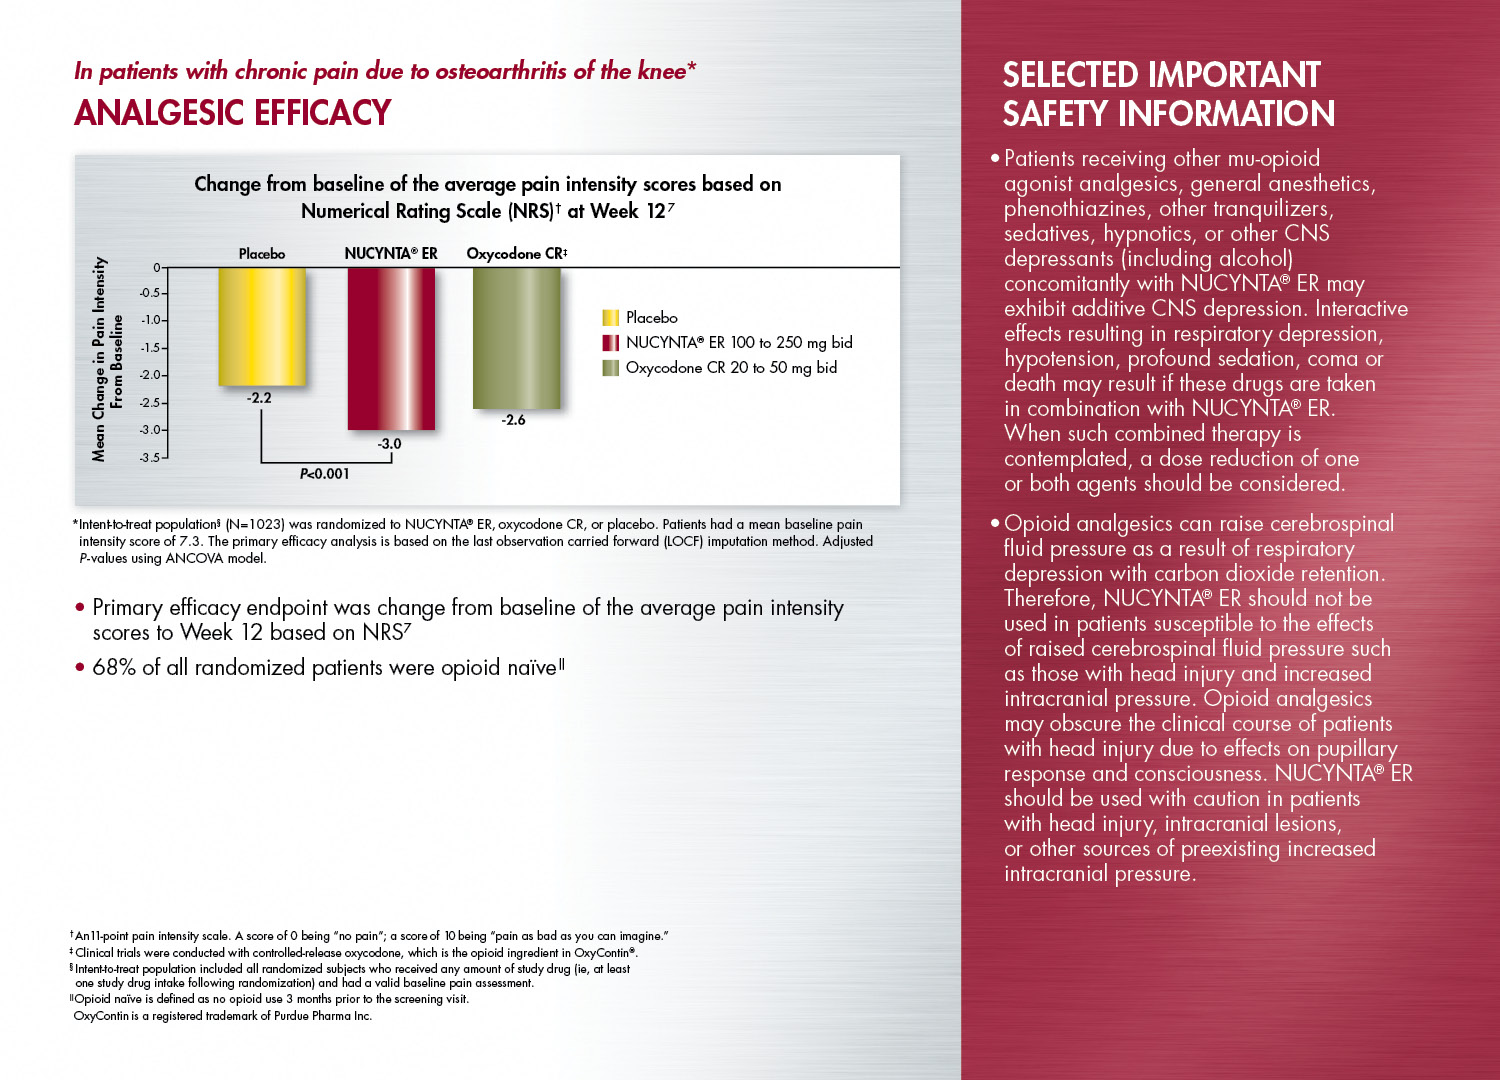
A slide from a presentation about the ANALGESIC EFFICACY (Analgesic Efficiency) of patients with chronic pain due to osteoarthritis of the knee. The slide has a red background and white text.
On the left side of the slide there is a bar graph that shows the change from baseline of the average pain intensity scores based on the number of patients who have been diagnosed with the condition. The graph is divided into three sections - red yellow and green. The red section shows the percentage of patients affected by the condition the yellow section shows a decrease in the percentage and the green section shows an increase in the number.
The slide also has a title that reads "Selected Important Safety Information" and below the title there are two bullet points that explain the importance of safety information in the presentation.
Type
Source 1 of 2
-
Date
2007
Collection
-
Date
2007
Collection
We encourage you to view the image in the context of its source document(s) and cite the source(s) when using these images. However, to cite just this image alone, click the “Cite This Image” button and then paste the copied text.
