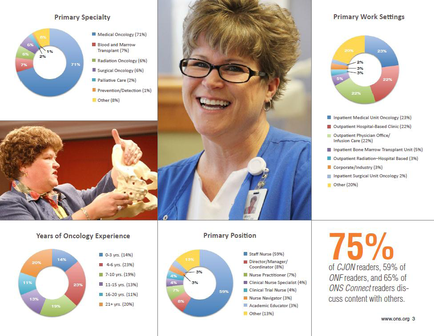
A collage of three different sections. The first section on the top left shows a pie chart that shows the percentage of people who have been diagnosed with cancer. The chart is divided into three sections - Primary Specialty Primary Work Settings and Years of Oncology Experience. In the top right section there is a photo of a woman with short blonde hair and glasses smiling at the camera. She is wearing a blue scrub top and a stethoscope around her neck. The background is blurred but it appears to be a hospital or clinic setting. The pie chart shows that the majority of people in the image are in primary work settings while the majority are in secondary work settings. The percentages in the pie chart are in different colors including red blue green and yellow and they are arranged in a circular pattern around the woman's neck and shoulders. The text on the right side of the image reads "Primary Work Settings" and "Primary Position". At the bottom of the idiographic there are three smaller sections each with a different percentage. The first section shows the years of oncology experience the second section shows a percentage of the percentage and the third section shows 75% of the people who are oncologists. The fourth section has a pie graph that shows that 75% are of con readers 59% of ONC readers. The fifth section has an image of a person holding a model of a human spine and there is text that reads "Oncologists with others."
Description 
Type
Category
-
Date
2013
Collection
We encourage you to view the image in the context of its source document(s) and cite the source(s) when using these images. However, to cite just this image alone, click the “Cite This Image” button and then paste the copied text.