


Title
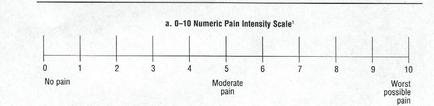
Numeric Pain Intensity Scale
Description
This chart quantifies the subjective experience of pain via a Numeric Pain Intensity Scale. It ranges from 0 (No pain) to 10 (Worst possible pain) with 5 (Moderate pain) at its midpoint.
Type 
Category
Source 1 of 6
-
Date
None
Collection
-
Date
2011
Collection
-
Date
2011
Collection
-
Date
2011
Collection
-
Date
2011
Collection
-
Date
2011
Collection
We encourage you to view the image in the context of its source document(s) and cite the source(s) when using these images. However, to cite just this image alone, click the “Cite This Image” button and then paste the copied text.