


Title
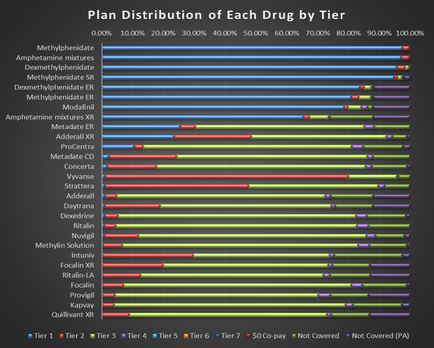
Plan distribution of each drug by tier
Description
This is a bar chart showing the coverage for 28 different drugs by tier. For example 98% of coverage for Methylphenidate comes from Tier 1 with the other 2% from Tier 2. There are 10 possible values for coverage : Tier 1 Tier 2 Tier 3 Tier 4 Tier 5 Tier 6 Tier 7 $0 Co-pay Not covered and Not covered (PA).
Type 
Category
-
Date
2015
Collection
We encourage you to view the image in the context of its source document(s) and cite the source(s) when using these images. However, to cite just this image alone, click the “Cite This Image” button and then paste the copied text.